
-
- Trading Platforms
- PU Prime App
- PU Copy Trading
- PU Web Trader
- MetaTrader 5
- MetaTrader 4
- PU Social
-
- Trading Conditions
- Account Types
- Spreads, Costs & Swaps
- Deposits & Withdrawals
- Fee & Charges
- Trading Hours
EN
Published: 18 March 2026,08:28
Daily Market Analysis New

*The US Dollar is in a short-term corrective phase around 99.50–99.60, driven by easing oil prices and a modest recovery in risk appetite.
*Geopolitical uncertainty, including limited NATO support for US actions in Iran, is creating near-term volatility for the USD.
*The USD remains supported structurally by higher US interest rates and relative energy independence versus Europe and Japan.
Market Summary:
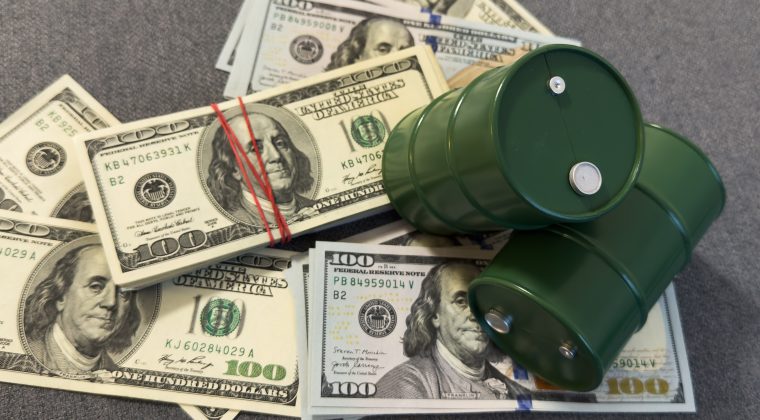
The US Dollar Index (DXY) is currently in a short-term corrective phase, drifting around the 99.50–99.60 region after a two-day decline. This pullback is mainly driven by a temporary easing in oil prices toward ~$95–$96 and a modest recovery in risk appetite, as markets interpret rising US crude inventories and partial reopening dynamics around the Strait of Hormuz as signs of short-term stabilization. At the same time, investors are reducing USD exposure ahead of the highly anticipated Federal Reserve decision, with expectations that rates will remain unchanged but with strong focus on forward guidance and updated economic projections.
From a macro perspective, USD positioning is increasingly sensitive to geopolitical headlines. Comments from Donald Trump suggesting limited NATO support for US operations in Iran have introduced new uncertainty into global alliances, weakening confidence in the dollar in the near term. However, paradoxically, the same geopolitical tensions continue to reinforce the USD’s role as the primary safe-haven currency, especially as the Middle East conflict enters its third week with ongoing threats to oil infrastructure and shipping routes. This dual dynamic uncertainty weighing on sentiment but risk supporting safe-haven demand is creating short-term volatility in the dollar.
Structurally, the USD remains supported by the “higher-for-longer” rate narrative. Markets have significantly scaled back expectations for Fed rate cuts, now pricing only limited easing this year as oil-driven inflation risks re-emerge. Rising energy prices are feeding into inflation expectations globally, which reduces the likelihood of aggressive monetary easing. Additionally, the US benefits from relative energy independence compared to Europe and Japan, making it less vulnerable to supply disruptions and reinforcing capital inflows into dollar-denominated assets during periods of stress.
That said, medium-term headwinds remain relevant. Analysts continue to highlight underlying weaknesses such as large fiscal deficits, political unpredictability, and concerns over policy credibility. These factors suggest that while the USD can remain strong in a risk-off or high-oil environment, its rally may be less sustainable if geopolitical tensions stabilize or if the Fed signals a clearer path toward easing later in the year.
Technical Analysis

The US Dollar Index has begun to lose upward momentum after failing to sustain its breakout above the 100.45 resistance level, a zone that previously acted as a key ceiling for price action. The recent rejection from this level signals a weakening bullish structure, with price slipping back toward the 99.50 support area, indicating that the prior breakout attempt lacked sufficient follow-through.
This pullback carries important technical implications. After rallying from the 97.30 region to a high near 100.45,the index is now retracing as sellers re-emerge near the highs. The failure to hold above the breakout level suggests a potential false breakout scenario, increasing the likelihood of further downside extension. If price decisively breaks below the 99.50 support, it could open the door for a deeper correction toward the 98.70 level, aligning with previous consolidation zones and short-term structural support.
Momentum indicators are beginning to reflect this shift in sentiment. The Relative Strength Index has turned lower from the upper range and is now drifting toward the mid-40 level, indicating fading bullish momentum and a gradual transition toward neutral-to-bearish conditions. Meanwhile, the Moving Average Convergence Divergence is rolling over, with the MACD line crossing below the signal line and the histogram expanding in negative territory, suggesting that downside momentum is building. Overall, the DXY appears to be entering a corrective phase following its recent rally, with the 99.50 level acting as a key pivot that may determine whether the pullback deepens or stabilizes in the near term.
Resistance Levels: 100.45, 101.25
Support Levels: 99.50, 98.70

Trade forex, indices, metal, and more at industry-low spreads and lightning-fast execution.
Sign up for a PU Prime Live Account with our hassle-free process.
Effortlessly fund your account with a wide range of channels and accepted currencies.
Access hundreds of instruments under market-leading trading conditions.
Trading Platforms
Learn
About PU Prime
Corporate


Please note the Website is intended for individuals residing in jurisdictions where accessing the Website is permitted by law.
Please note that PU Prime and its affiliated entities are neither established nor operating in your home jurisdiction.
By clicking the "Acknowledge" button, you confirm that you are entering this website solely based on your initiative and not as a result of any specific marketing outreach. You wish to obtain information from this website which is provided on reverse solicitation in accordance with the laws of your home jurisdiction.
Thank You for Your Acknowledgement!
Ten en cuenta que el sitio web está destinado a personas que residen en jurisdicciones donde el acceso al sitio web está permitido por la ley.
Ten en cuenta que PU Prime y sus entidades afiliadas no están establecidas ni operan en tu jurisdicción de origen.
Al hacer clic en el botón "Aceptar", confirmas que estás ingresando a este sitio web por tu propia iniciativa y no como resultado de ningún esfuerzo de marketing específico. Deseas obtener información de este sitio web que se proporciona mediante solicitud inversa de acuerdo con las leyes de tu jurisdicción de origen.
Thank You for Your Acknowledgement!